YeboReports
Create a .Net MVC Self-Hosted Dashboard and Reporting for Secure, Scalable Business Intelligence
Getting Started
1. Creating Stored Procedures
The first step towards created a Dashboard and Reports is to create a stored procedures to fetch the data.
For our On line demo we have already created stored procedures for you.
Store procedures for Reports, Dashboards and Vertical reports:
- stp_Test_Courses_Status
- stp_Test_Courses_GetAll
- stp_Test_Students_GetAll
- stp_Test_University_Assets
- stp_Test_Universtiy_Workers_GetAll
- stp_Test_University_Awards
Store procedures for Sub reports only:
- stp_Test_Student_Payments_GetAll
- stp_Test_Student_Course_GetAll
We will explain later on what is a sub report.
2. Creating Reports
-
Task 1
Creating Permission first
Before you create a report/dashboard/vertical report it is better to standard with permisison first.
That will lead to less confusion. Permissions are called 'Roles', think of a role as a user department.
So you need to create Roles as follows
- Finance Department Role
- IT Department Role
- Marketing Role
There are times where a manager of a department has extra reports that other users cant see.
In that case we create another role
- Finance Department Manager Role
- IT Department Manager Role
- Marketing Manager Role
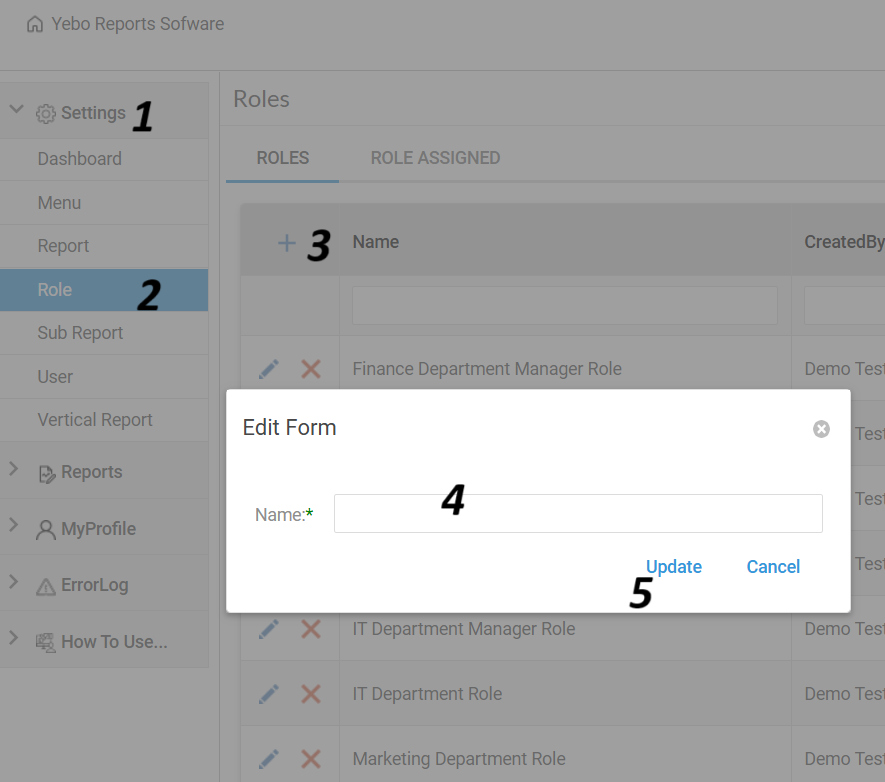
To Create a Role, Goto Settings/Roles
Click the '+' on the Roles Grid, Add a new Role and Click Update
-
Task 2
Assigning Roles to the User
To Assign a role to the user, go to Settings/Users/Roles Column Click
the '+' on the Roles Column for the user "Demo Test".
You will see a list of Roles
that you created on Task 1. Choose the roles that you need and Click Update.
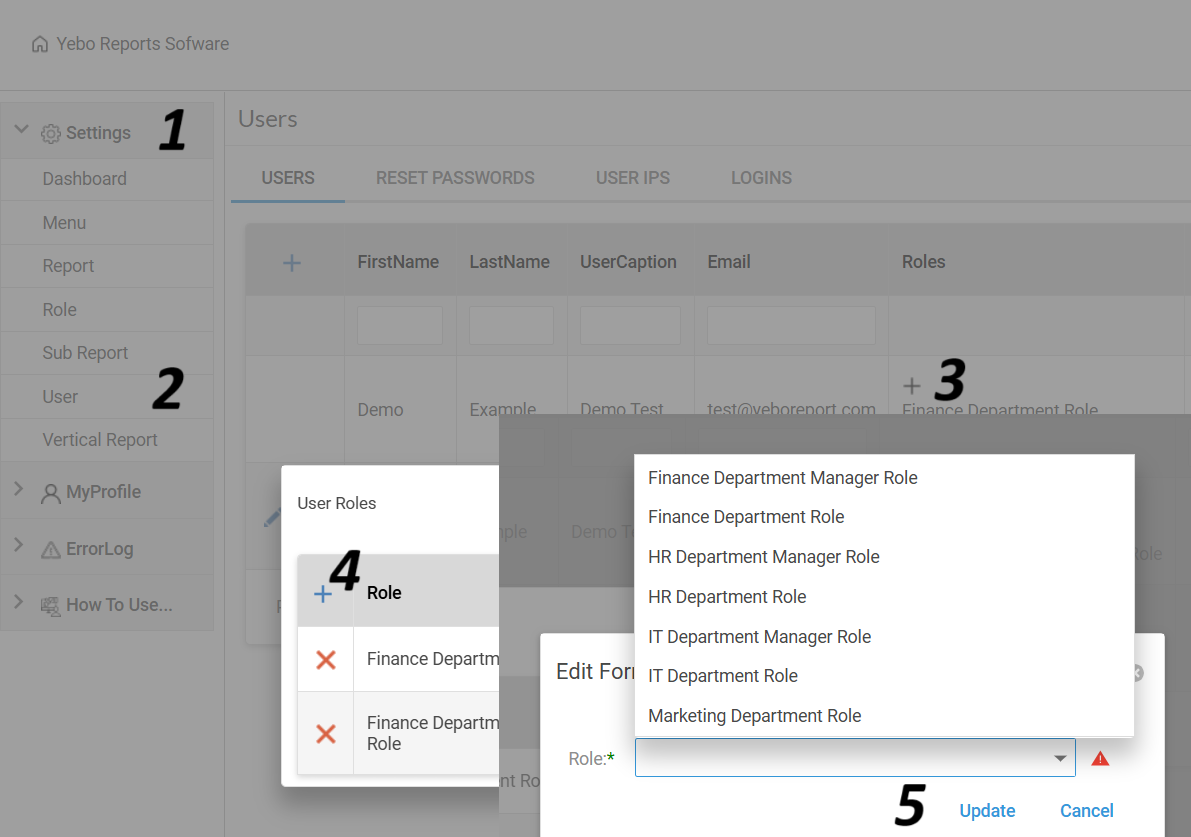
For this demo let us choose the following roles:
- Finance Department Role
- Finance Department Manager Role
-
Task 3
Create the Report
- Go to Settings/Report, Click the 'Plus' on the Grid header
-
Fill in the Report name
On your stored procedure, select stp_Test_Students_GetAll
- Save your form

-
Task 4
Setting up report permission
The report that we created on Task 3 does not have any permission, so no body will see it.
- Look for the report that we created on Task 3 , look for column Roles, Click the plus on the Roles column
- Add the 'finance department role' and click update
- You will see a new report on your menu, See screenshot below Point 7

-
Task 5
Viewing Report Data
You should see a new menu Reports , Look for a the report that you created and click it.

-
Task 6
Adding a SubReport
- Go to Settings/SubReport
- Click the '+' on the subReport Grid
- Fill in the name , on the stored procedure select stp_Test_Student_Course_GetAll
Note: You dont need to setup permission for the subreport.
-
Task 7
Linking a SubReport to the Report
- Go to Settings/Report
- Find the first Report that you created on Task 3
- Locate the colum SubReport ,Click the '+' icon, then select the subreport that we created on Task 6

-
Task 8
Viewing a SubReport Data
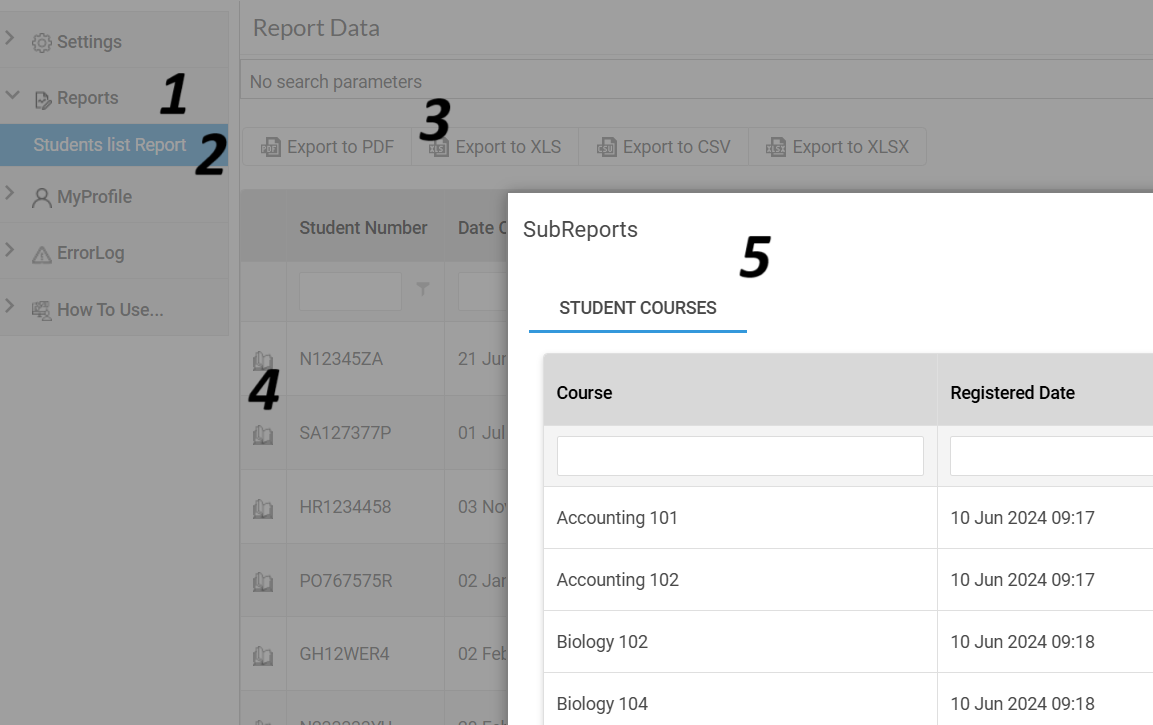
- Go to Reports
- Find the first Report that you created on Task 3
- Click the Report
- You will see an icon on the first column, click that icon, a subreport with data will show

-
Task 9
Editting report settings
At the moment we cant down the data into Excel,let us fix that
- Go to Settings/Report
- Click the edit icon
- Change IsDataExportAllowed to checked
- Change Show SubReport as popup to checked
- Click Update

Let us view our changes.
- Go to Reports/Select your report.
- You see an option to Export the report and your subreport will now open as popup
2. Creating A Dashboard
Dashboard needs permission as well, but we will not create new permission since we created them on
Task 1
-
Task 9 Create dashboard
First step is to Create a Dashboard info.
- To create a dashboard Go to Settings/Dashboard
- Click the 'Plus' on the Grid header - Then Add a new Dashboard

-
Task 9 Now we need to assign the Permission to the dashboard
- Look for the dashboard that you have just created, Click '+' on the Role column
-
Assign the same roles that you assigned to the report, check "CanEdit"
- Finance Department Role
- Finance Department Manager Role
- Select the Dashboard you have just created
- Select the Permission 'CanEdit'

-
Let us Edit the Dashboard and Add Graphs and Icons.
- Goto the Dashboard that you created on stepm 8
- Click the Dashboard icon next to the Dashboard name

-
Your can start editing your Dashboard
- On your Far left, look for a list of icons
- Locate a Text editor icon
- Drag it into the screen
- Edit the Text
- Click "File" on the menu
- Click "Save"
- Click the Back button on your browser (Exit editor)
-
Go to the Home page, you should see your New Dashboard.
-
Embed a Dashboard into another website. You can also send this link to someone to view the Dashboard without having to login.
- On Main Menu, Click Settings/Dashboard/Dashboard Remote Access
- Click the '+' icon
- Fill in the Required info
- Click "Save"
- Go to the new created row, copy the dashboard URL and Send it to your users
-


